Updated: January, 2010
This work is licensed under a
Creative
Commons
Attribution-Noncommercial
3.0 Unported License
.
Some years ago, I wrote Design
and
Construction
of
Centerboards
and
Rudders. This was a
compilation of information, comments and suggestions from various
experienced people. At that time, I stated:
Determining a "good" foil shape requires either experimental models or a rather large computer program to determine the lift and drag as a function of AOA for a variety of candidate shapes. Then repeat that process for a range of speeds. Final select a shape based on the expected conditions and your sailing style. The problem is just too complex to have a computer program that solves Newton's Laws of Motion and cranks out the "best" shape.
Since that time, computers have become more powerful and several programs for analyzing fluid flow have become available. One such program is XFOIL, developed by Professor Mark Drela at MIT. XFOIL is widely used for subsonic air plane design. It can be downloaded from http://web.mit.edu/drela/Public/web/xfoil/ and a brief but good tutorial can be found at http://cobweb.ecn.purdue.edu/~aae333/XFOIL/Tutorial/Tutorial%20for%20XFoil.htm.
The same laws of fluid mechanics apply to the airfoils (wings, rudders, and elevators) on airplanes and the foils (centerboards, dagger boards, and rudders) on sailboats. A lot of experimental and theoretical work has been put into developing better airfoils. A foil shape that is useful for an airplane wing is potentially useful for sailboats.
In
airplanes,
lift
is
the vertical
force,
perpendicular
to the wings, that allows
the plane to fly. In sailboats lift is the sideways
force against the centerboard that makes it possible to sail to
windward. Drag is the force retarding the forward motion. Lift and drag
can be computed from the
formulas
FL= ρ * v2
* A * CL /2
FD= ρ * v2 * A * CD /2
where
Looking at these equations shows that the forces go up with the area. Doubling the size of the centerboard doubles the forces.
The forces increase as the square of the
velocity. Doubling the speed, increases the forces by 4 times.
It is not too difficult to decide on the
speed of the boat, compute
the area of the centerboard, and look up the density of water. However,
CD
and CL are much more difficult. They depend the shape, the angle
with respect to the flow and even the velocity. What
makes CD and CL useful is that they make it possible to compare
different shapes. For the same size and speed, a centerboard with
lower CD will have less drag, and a centerboard with high CL will
have more lift. The rest of this paper will focus on CL and CD as
computed using XFOIL.
Given the description of the cross
section, XFOIL can plot the flow and from that compute the lift and
drag.
|
|
|
Figure 1. Example output from XFOIL |
Figure 1 shows a typical
output from XFOIL. The right side of the screen shot lists the
foil name, and important parameters. Re is Reynolds Number, which will
be described in the next section. The Greek
letter, alpha, is the angle of attack, the angle between the center
line
of the foil and the flow. CL is the coefficient of lift.
CD is the coefficient of drag. L/D is the ratio lift to drag.
At
the bottom is a cross section of the foil. The blue and red
lines show how the water separates and flows around the top and
bottom side.
The large graph shows the pressure at different places along
the top and bottom surfaces. The red line shows the pressure
pushing against the lower side of the foil. The blue line shows the
reduced pressure "pulling" on the upper side. The pressures are
combined to compute the coefficient of lift. The graph makes it
obvious that, in this example, most of the lift is created by the flow
over the top of
the foil.
Describing how the flow separates
around the top and bottom brings us to the topic of boundary layers.
The term, boundary layer, applies to
the region around the foil where the water flow is slowed and / or
deflected by the foil. Close to either the top or bottom
surfaces, the water speed is speed is very slow because of
friction. Speed increases with distance from the surface until
it reaches the average speed of the flow of water around the
foil. In between is the boundary layer.
In Figure 1, the angle of attack, is 10 degrees. The flow divides at a point a little below the front of the foil. The red flow is pressed against the bottom surface until it reaches the trailing edge. The boundary layer is thin and follows the shape of the lower surface. The boundary layer is said to be "laminar" because it can be analyzed as thin parallel layers.
The blue flow is somewhat more
complicated. First it must curve
around the leading edged then turn to flow back toward the
trailing edge. Although the boundary layer near the trailing edge is
thicker, it is still laminar.
The flow is also said to be "attached"
because the entire boundary layer follows the overall shape of the
surface.
 |
| Figure 2: Laminar flow |
Figure 2 shows another example of
laminar flow. In this example, the speed is much less than in the
previous examples. (Actually the speed corresponds to a boat that is
barely moving. The purpose is to give examples of the variety of flows
that can happen with the same shape.) The force pressing the water to
the board are
reduced and so the boundary layers are thicker. The pink "whiskers" are
actually mini-graphs showing how the speed increases with distance from
the surface.
Laminar flow is a topic of much
interest to air plane designers. With calm air at high altitudes
it is quite possible to actually have a thick, laminar boundary
layer. Water is a different situation. Bubbles, waves,
small motions of the boat can upset the laminar flow with the result
shown in Figure 3.
 |
| Figure 3: Turbulent, Attached
Flow |
The only difference between Figures 2
and 3 is that a parameter of XFOIL was changed to magnify the effects
of irregularities in the flow. The result is turbulent flow. The flow
in the graphs only shows the average flow over time. In reality,
the flow is
really churning over and over along the upper side.
Many texts on laminar and turbulent
flow suggest that laminar is "good" and turbulent is "bad".
Certainly inside a water pipe, laminar is quieter and takes less energy
from the pump. In the marine environment, things are different.
In some circumstances, it is hard to avoid turbulent flow in the water
around a boat going at
any speed, especially if there are waves.
Silicon polish and 1600 grit abrasives make a slick surface which can
help with laminar flow, but they can only do so much.
In Figure3 the flow is still
attached to the
upper surface. The lift is greater and the drag is actually less
for the laminar flow.
For the rest of this paper, unless
otherwise noted, if the conditions could have either laminar and
turbulent flow, XFOIL will be set for turbulent flow.
 |
| Figure 4: Separated Flow |
In Figure 4, the angle of attack has
been increased to 30o. The flow on the upper surface
is so far from the surface that it is described as
"separated". There is a huge turbulent boundary
layer. The turbulence extends for a long distance in the wake.
The lift is reduced while the drag is almost as large as the lift.
This is what happens when the rudder is turned too hard. The boat turns, but there is so much drag that it is like putting on the brakes. Experienced helmsmen know to avoid turning the tiller further than necessary.
The last of the mathematical concepts
in this paper is Reynolds number. Reynolds number combines the
size
of the object with speed and the characteristics of the fluid (water
or air) to give a dimensionless number.
|
RE = V * L / kv |
|
|
where |
V is the velocity |
|
|
L is the length (fore and aft) of the foil |
|
|
kv is kinematic viscosity |
|
|
kv = ~10-5 ft2/sec or 10-6 m2/sec for water |
The key to understanding Reynolds number is this: if two different situations have the same Reynolds numbers the fluid flow will be the same. This allows one to take results for airplane wings and apply them to center boards and rudders. It also allows comparing big boats with small boats and fast boats with slow boats. If the dimensions are unchanged, then increasing RE can be interpreted as a simply a change in speed. The following graphs show effect of Reynolds Number with the same shape and same angle of attack.
|
|
|
|
|
|
|
|
|
Figure 5: Flow for NACA 0010; RE 30,000 (Small boat going very slow) |
Figure 6: Flow for NACA 0010; RE 300,000 (Small boat at modest speed; or large boat going slow) |
Figure 7: Flow for NACA 0010; RE 3,000,000 (Large boat going fast) |
Figures 5, 6 and 7 are for Reynolds
Numbers of of 30,000, 300000 and 3,000,000 respectively. This covers
the range from small boats sailing very slowly to larger boats going
fast. Each graph shows the behavior of the CL
and CD
different angles of attack. CL uses the
scale on the left. CD uses the expanded scale on the right.
Referring to Fig 5, as the
angle increases, the lift increases
reaching a maximum for AOA around 9 or 10 degrees. For greater AOA, the
lift decreases. Drag also increases with angle, and
increases rapidly above 10o. Considering both lift and
drag, the optimum performance will be in the range of 6o to 8o.
Higher
angles
generate
more
lift,
but
the
increased
drag
slows
the
boat.
In
a
very
over-simplified
way,
this
is
the
difference
between
sailing
on
the
"best"
close-hauled
angle
and
"pinching"
to
a higher angle, but going slower.
Figures 6 and 7 show what happens as
Reynolds Number (or boat speed for a fixed size) increases. The
increased forces press the
water closer to the surface of the centerboard. The angles for maximum
CL increase. For any angle, the higher RE has lower CD.
If we compare all of the graphs, there
is an interesting result. CL is essentially independent of RE. For
example,
for AOA of 5o,
CL is 0.5. The significant effect of RE
is the angle for maximum CL. Of course, the actual force
force increases as the speed squared.
One more comment. XFOIL is
strictly a 2 dimensional simulation. In the 3D world, there are a
number of effects, including the surface of the water, the presence of
the boat hull, the centerboard being relatively short, which made the
drag greater than the numbers shown here.
The most asked question has been how thick a center board should be. The NACA 00XX formula for foils is a general purpose formula which is intended to be scaled for different thicknesses. The last two digits represent the thicknesses as a percentage of the chord length. For example, NACA 0010 has a thicknesses that is 10% of the (fore and aft) length. The is the formula:
![]()
where:
x is the
position along the chord from 0 to 1
y is the thickness at a given
value of x
t is the maximum thickness as a fraction of the chord
Here is the same formula formatted so it can be copied and pasted to your spread sheet or other program.
y = (t / 0.2) * ( 0.2969 * SQR(x) - 0.1260 * x - 0.3516 * x2 + 0.2843 * x3 - 0.1015 * x4 )
 |
 |
| Figure 8:
Lift and drag for different thicknesses |
Figure 9: Lift and drag for different thicknesses |
Foil shapes are typically shown with
a sharp trailing edge. Accordingly people making centerboards
and rudders try to make the trailing edge very thin. This leads
to a fragile foil. Builders have devised all manner of
reinforcement including metal, fiber glass and carbon fiber. I
once made a board using thin pieces of electronic circuit board
fiberglass inlaid
into the wood to reinforce the trailing edge. Over time, sharp
edged centerboard can actually cut into the centerboard trunk!
Is
this really necessary? What is the effect of making the
trailing edge a little thicker? XFOIL makes the effect easy to
compute.
|
|
|
Figure 10: NACA 0010 with original thin trailing edge. |
Figure 10 shows the flow over the NACA 0010 shape and 10o angle of attack, which is within a fraction of a degree of the stall point. The following figures show the effect of a slightly thicker trailing edge.
|
|
|
|
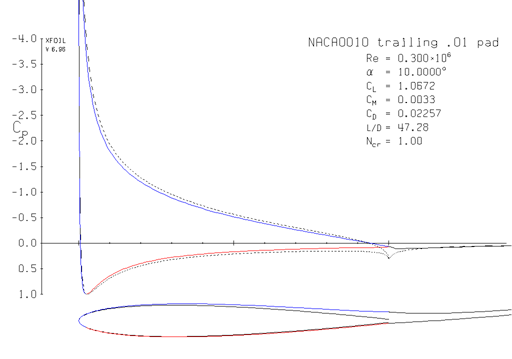
Figure 11: NACA 0010; trailing edge padded to .01 thickness |
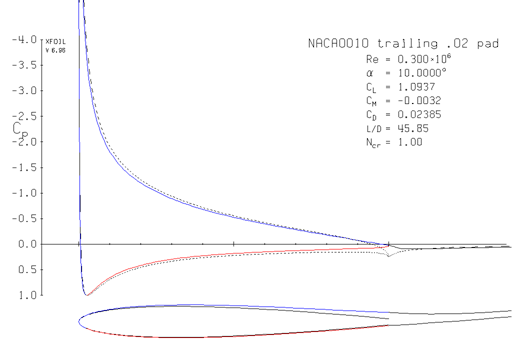
Figure 12: NACA 0010; trailing edge padded to .02 thickness |
Figures 11 and 12 show the NACA 0010
shape with the trailing edge made thicker. The "padding"
was a maximum at the trailing edge and reduced to zero at the
midpoint of the foil. A trailing edge of .01 and a chord length
of 12 inches would result in trailing edge of 1/8 inch. The
thicker foil would be approximately 1/4 inch thick at the trailing
edge. These thicknesses would be possible to make out of wood
without special reinforcements.
As for performance, the lift
and lift to drag ratio are actually a tiny bit better with the
thicker trailing edge! Also the angle of attack for maximum
lift is also increased by a fraction of a degree.
|
|
|
|
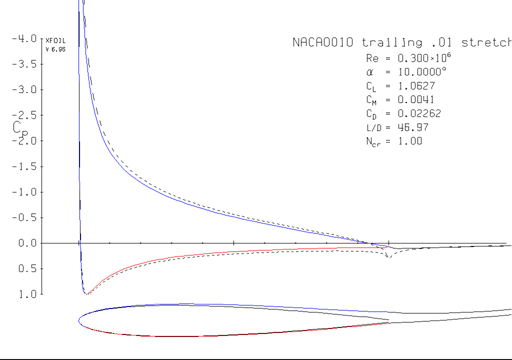
Figure 13: NACA 0010; stretched for trailing edge .01 thick |
Figure 14: NACA 0010; stretched for trailing edge.02 thick |
Figures 13 and 14 show the effect
of mathematically stretching the foil shape and then cutting it off
to achieve the desired trailing edge thickness. This causes a
slight distortion along the entire length of the foil. This
process also slightly increases the lift, but the drag and lift to
drag ratio are worse.
So the suggestion for the trailing
edge is to first decide on the thickness that is practical to make with
the desired materials. Then add a little thickness all along
the back half of the shape when computing the profile to make.
Don't go to excessive efforts to make the edge extra thin.
|
|
|
Figure 15: Extra foil section |
 |
 |
| Figure 16:
Extra for Reynolds
Number 300,000 |
Figure 17: Extra for Reynolds Number 3,000,000 |
Prof. Michael Selig of the University of Illinois, John Donovan and others have spent a lot of time with experimenting with model gliders. Using the wind tunnels and computer simulations, they developed a number of wing sections for use at the low Reynolds numbers associated with small planes at low speeds. Many of the wing sections are designated "SD". Most are not symmetrical, which is good for a wing that never flies upside down. This is not useful for a centerboard (unless you change centerboards when you go from port to starboard tack.)
The one symmetrical SD design is SD8020. Unlike the NACA
formula, SD8020 was designed to be the best thickness
for their specific purpose. It really wasn't intended to be
scaled to thinner or thicker sections. This doesn't prevent
multiplying their data to yield thinner or thicker shapes, but it is
not really correct to call these "SD8020".
That said, Figures 18 and 19 show CL and CD for SD8020 and also
versions scaled to 6%, 8% and 12% thickness.
 |
 |
| Figure 18:
SD8020 for Reynolds Number 300,000 |
Figure 19:
SD8020 for Reynolds Number 3,000,000 |
For the range of RE of interest to most sailors, NACA 0010 and
SD8020 perform similarly. The biggest difference is that the lift of
the
thinner variations doesn't drop off as fast small increases in AOA
above the angle for maximum.
where:
y is the
thickness at a given
value of x
Tmax is the maximum thickness as a fraction of the chord
x is the
position along the chord from 0 to 1
Xle is the length of the tapered leading edge
where:
y is the
thickness at a given
value of x
Tmax is the maximum thickness as a fraction of the chord
x is the
position along the chord
IN THIS FORMULA,
x is 0 at the beginning of the taper and
x increases to Xte at the trailing edge of the foil
Xte is the
length of the tapered trailing edge
 |
 |
| Figure 20:
Parallel Sided board with Reynolds
Number 300,000 |
Figure 21: Parallel Sided board with Reynolds Number 3,000,000 |
 |
 |
| Figure 21:
Extra foil, thickest at 0.300 |
Figure 22:
Extra foil, thickest at 0.200 |
| Coefficient of Lift |
NACA 0006
AOA
|
NACA 0006
CD
|
SD8020 (6%)
AOA
|
SD8020 (6%)
CD
|
New Shape
AOA
|
New Shape CD
|
| 0.5 |
4.6 |
0.012 |
4.5 |
0.012 |
4.5 |
0.013 |
| 0.6 |
5.6 |
0.014 |
5.6 |
0.015 |
5.4 |
0.014 |
| 0.7 | 6.6 |
0.017 |
6.7 |
0.021 |
6.3 |
0.015 |
| 0.8 |
7.8 |
0.029 |
-- |
-- |
7.2 |
0.018 |
| 0.9 |
19.8 |
0.258 |
-- | -- | 8.1 |
0.020 |
| 1.0 |
-- | -- | -- | -- | 9.1 |
0.024 |
| 1.1 |
-- | -- |
-- |
-- |
10.3 |
0.036 |